# Introduction
One of the founding fathers of spectroscopy is Issac Newton, who observed the color series using a prism and sunlight1 - he called this color series 'spectrum' (Latin for 'appearance'). Many well-known researchers continued these observations over the decades and laid the foundations for today's knowledge, including Frederick William Herschel, Thomas Johann Seebeck, Joseph von Fraunhofer, Robert Kirchhoff and Robert Wilhelm Bunsen. It was only much later, at the end of the 19th century, that the term spectroscopy was coined, using the Greek root 'skopein' for 'to look' alongside 'spectrum'. Likewise, the observations later became calculable through physics.
In general, spectroscopy describes the interaction of any electromagnetic radiation with (again, any type of) matter, with the purpose of investigating this matter. The intensity distribution of the resulting radiation as a function of wavelength, frequency or energy is called a 'spectrum'. The following both relationships are elementary for spectroscopy:
[](https://hyperspectral-vision.info/uploads/images/gallery/2024-08/ehv.png)
[](https://hyperspectral-vision.info/uploads/images/gallery/2024-08/clambdav.png)
*(c speed of light, ν frequency, λ wavelength, h Planck's quantum of action and E energy)*
[](https://hyperspectral-vision.info/uploads/images/gallery/2024-08/spectroscopy.png)
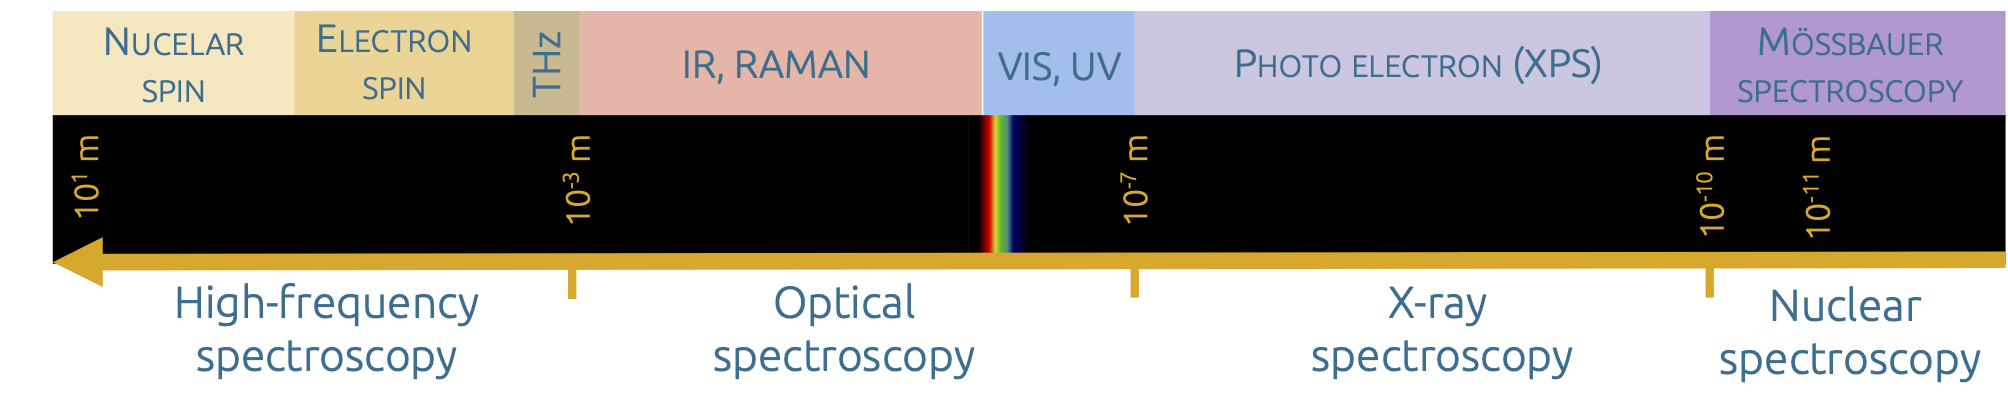
*Overview of the electromagnetic spectral range and the associated spectroscopic methods*
Spectroscopy is just as diverse as electromagnetic radiation. Spectroscopic methods provide information about the qualitative and quantitative composition of the matter studied. The signature of the electromagnetic radiation after interaction with the matter is specific to the type of matter and may also provide a correlation to the concentration. One of the basic relationships is described by the so-called 'Lambert-Beer's law':
[](https://hyperspectral-vision.info/uploads/images/gallery/2024-08/lambert-beer.png)
*(Eλ extinction or absorbance at the wavelength λ, I0 intensity of the irradiated electromagnetic radiation at the wavelength λ, I1 resulting intensity of the electromagnetic radiation at the wavelength λ, ελ extinction coefficient or spectral absorption coefficient at the wavelength λ, c concentration, d layer thickness)*
However, spectroscopic methods per se do not provide any information about sample sizes, structure widths or other spatial scales.
References:
A. A. Mills, „*Newton's prisms and his experiments on the spectrum“*, The royal society journal of the history of science, 1981, 36(1), https://doi.org/10.1098/rsnr.1981.0002